Radio Detection and Ranging: Generation of Displacement Map
Analysis of the ground deformation caused by the Beirut explosion in August 2020 using Sentinel-1 InSAR data.
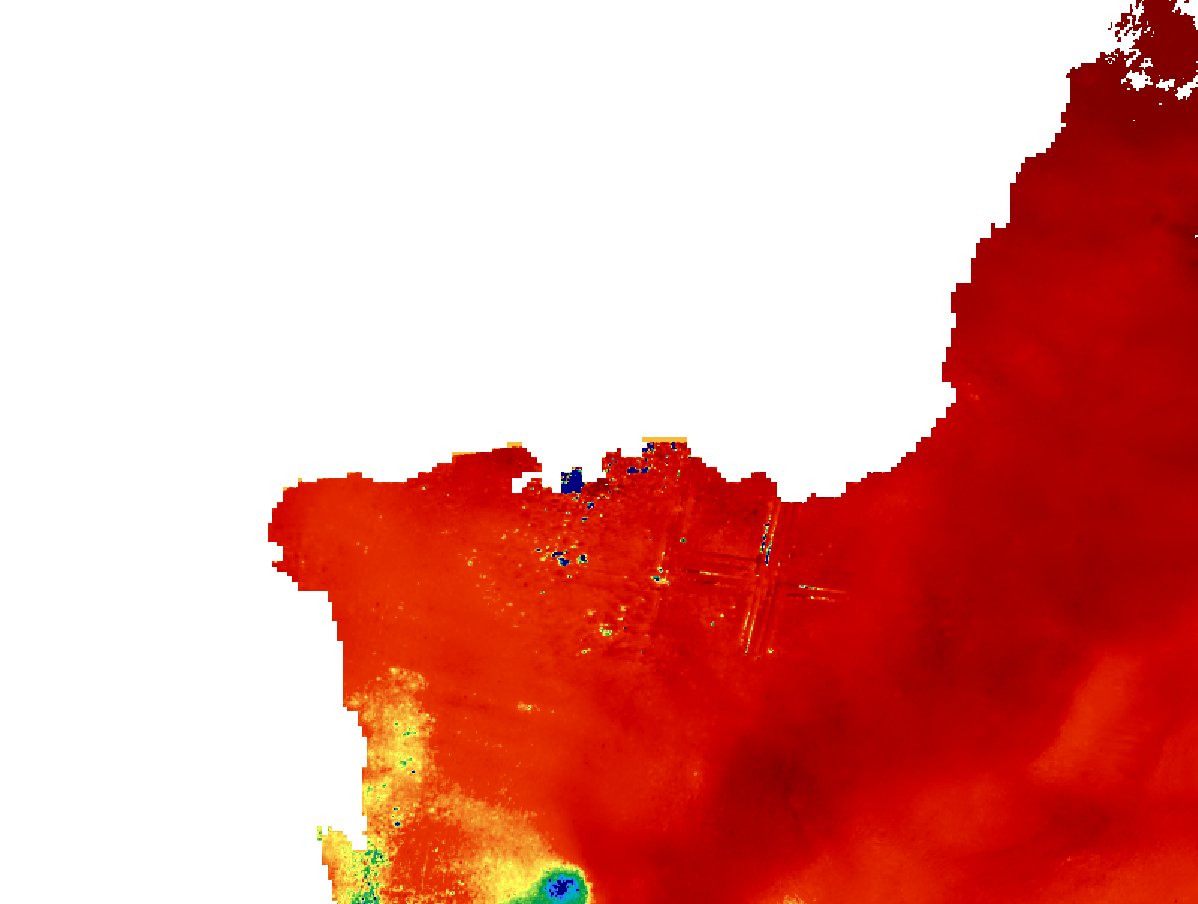
Displacement Map
1. Introduction
Imaging Radar has been widely used for the past 50 years for remote sensing applications (Lang et al., 2025). With advances in radar technology, Synthetic Aperture Radar (SAR) emerged, providing high-resolution, weather-independent images during day and night.
SAR is applied in geoscience and climate change research, environmental monitoring, elevation model generation, change detection, and Earth surface exploration (Moreira et al., 2013).
This assignment focuses on SAR interferometry (InSAR). Two images acquired at different times were used in a differential interferometry (D-InSAR) approach to generate a displacement map of the Beirut harbour area affected by the August 2020 explosion.
A major challenge in InSAR is phase ambiguity, as the sensor measures phase modulo 2π. Phase unwrapping resolves this ambiguity, allowing displacement to be retrieved with centimetric or millimetric accuracy.
2. Study Area and Event
On August 4th, 2020, a fire at the port of Beirut ignited approximately 2,750 tonnes of ammonium nitrate, causing one of the largest non-nuclear explosions ever recorded.
According to the USGS Earthquake Hazard Program, the explosion generated seismic waves equivalent to a magnitude 3.3 earthquake, roughly corresponding to 1,100 tons of TNT.
The site is particularly relevant due to the extreme intensity of the event and the availability of satellite and seismic data for analysis.
3. Dataset
| Parameter | Slave Image | Master Image |
|---|---|---|
| Date | 25 July 2020 | 6 August 2020 |
| Mode | IW | IW |
| Satellite | Sentinel-1B | Sentinel-1B |
| Orbit Number | 22622 | 22797 |
| Pass Direction | Descending | Descending |
| Polarization | VV + VH | VV + VH |
| Product Type | SLC | SLC |
| Path | 21 | 21 |
| Frame | 480 | 480 |
4. Methodology
The dataset was acquired from the Alaska Satellite Facility (ASF) archive and processed using ESA SNAP software.
- Sub-swath selection and orbit file application
- Coregistration of master and slave images
- Topographic interferogram generation
- Removal of topographic phase using SRTM 1Sec DEM
- Multilooking (8 range, 2 azimuth)
- Goldstein filtering (α = 0.6)
- Phase unwrapping using SNAPHU
- Phase-to-displacement conversion
- Terrain correction (WGS84)
The workflow resulted in 15 intermediate products within the SNAP environment.
5. Results and Discussion
The displacement map shows ground deformation linked to the Beirut explosion. Subsidence values below -2.5 cm indicate significant displacement around the harbour.
Maximum observed displacement reached approximately -2.7 cm. Due to the surface nature of the explosion, seismic waves did not propagate over large distances.
While the overall quality is sufficient for visualisation, noise artifacts and uniform negative displacement suggest minor inaccuracies, possibly linked to orbit geometry.
Annex
a. Phase–Displacement Relationship
Δr = (λ / 2π) · m · ψ(s)
Where λ is the radar wavelength, ψ(s) the absolute phase difference, and m the transmit–receive factor.
b. Geometric Relationship
Δr = (B / (r(s) · sinθ)) · h(s)
Where B is the baseline, r(s) the slant range, θ the incidence angle, and h(s) the terrain height.
References
- Agapiou, A. (2020). Sensors, 20(21), 6382.
- Al-Jazeera Staff (2022). How big was the Beirut explosion?
- Moreira et al. (2013). IEEE GRSM.
- USGS (2020). M 3.3 Explosion — Beirut, Lebanon.
- Yu et al. (2019). IEEE GRSM.